 EMAiCloud
Before the day: already waiting, not chasing
Since the previous week several strategies had identified the same support area around 4,237–4,248 and placed sell stops below it (picture below, Time column: some orders date from the 24th). The system never sees a move and jumps after it — it decides in advance, while the market is quiet, and lets the market come to the order.
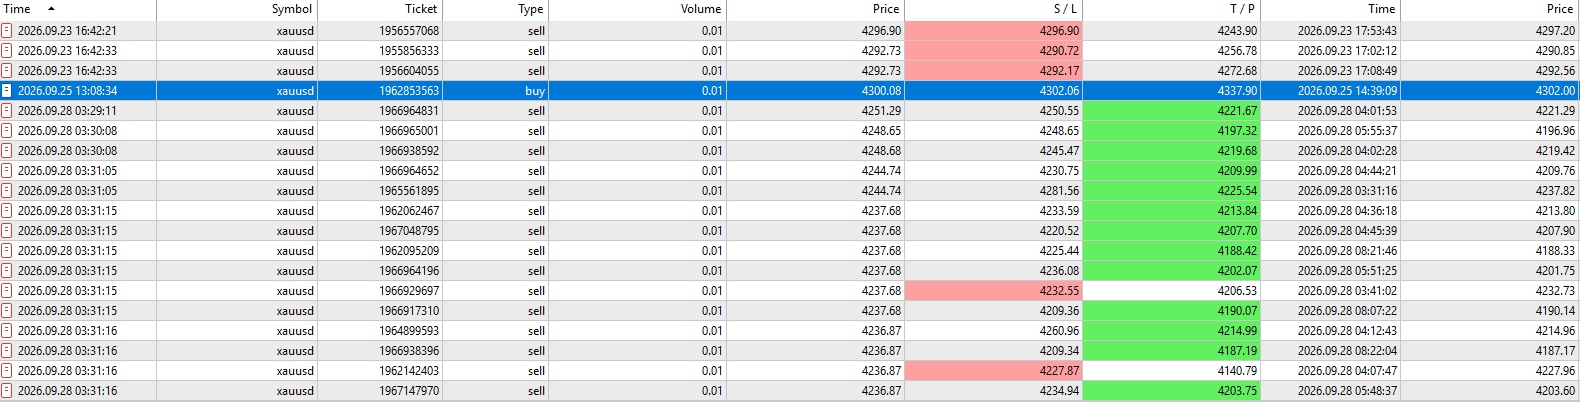
03:29–03:31: two minutes in which the team enters together
When price broke the support, the waiting orders filled within two minutes, several strategies at nearby levels. That is what a team looking at the same level from different timeframes does — on a day that goes right it is momentum, on a day that goes wrong it is several trades hurting at once. The manual says so, and two settings (Array_MaxPerLevel, Array_UsdPerPosition) let you limit it if you prefer.
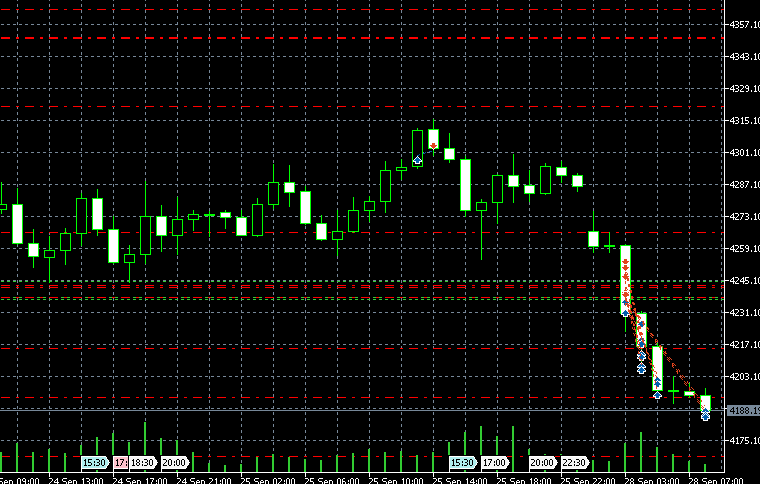
04:00–08:20: exits one by one, not all at once
Look at the right-hand Time column — trades closed from 4 am to just after 8 am. Each strategy has its own target and its own distances; some reached the target, some were taken out by the trailing stop as price started to bounce. Nothing was “closed all” by a single decision.
The trades still open: already locked
The remaining trades had their stop loss moved below the entry price (S/L column). Whatever gold does next, those trades end with part of the move kept, not with a return to a loss — that is break-even and trailing doing their job on the broker's server, even with the computer off.
The panel
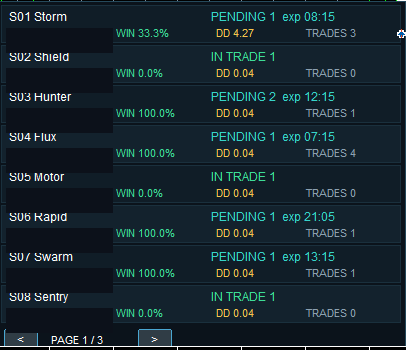
Each row says what that strategy is doing: IN TRADE, PENDING exp 08:15 (an order is waiting and when it expires), READY next 09:00 (idle, looks for a new level on the next bar). You never have to guess whether the system is stuck or waiting.
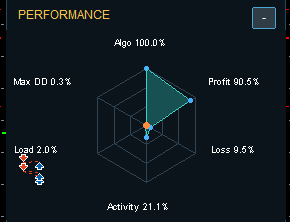
The other side
This is a demo account, and this was a day that went the system's way. A breakout system does well when price travels and gives back small losses when price swings inside a range — and there are more of the second kind of day than the first. We will write up the worst day in exactly this format when it comes, because anyone running the system needs to see both.
The day described here is a demo account, not a live one. The ten-year backtest and its full reports are on the EA page.
This article explains how the software works. It is not investment advice. Trading gold carries a high level of risk, and one day says nothing about the long run.